Maps: August 2020 Archives
Tulsa Mayor GT Bynum IV narrowly avoided a November runoff, winning re-election outright with 51.9% in this first round of City of Tulsa voting. 30-year-old Greg Robinson II, running to Bynum's left, garnered 28.8% of the vote. Ken Reddick, running to Bynum's right, finished third with 13.8%, followed by Ty Walker at 2.8% and Craig Immel at 1.9%, the remaining candidates were below 1%. Turnout was 70,745, with 23.0% voting early. Had another 2,637 voters turned out to vote for candidates other than Bynum, he would have faced a November runoff with Robinson.
I'll be on Talk Radio 1170 KFAQ at 7:30 am Wednesday morning to talk about the results with Pat Campbell.
I had an enjoyable time as a member of a panel of commentators for KJRH's election night coverage, talking about the results and their significance. One of the striking things about the conversation was hearing about the Democratic Party's endorsement of Robinson, setting a precedent that Republicans would do well to follow. The Tulsa County Democratic Party chairman said something about flipping a council seat, which was humorously revealing. We all know that political philosophy matters, even in city government, and that people have party affiliations, despite the lack of a partisan primary. About 15 years ago, I proposed an idea I called multi-partisan elections, in which candidates of all parties would run on the same ballot, but with party labels, which might include words and phrases other than the names of national parties. The label next to a candidate's name might be that of a local coalition formed around local issues.
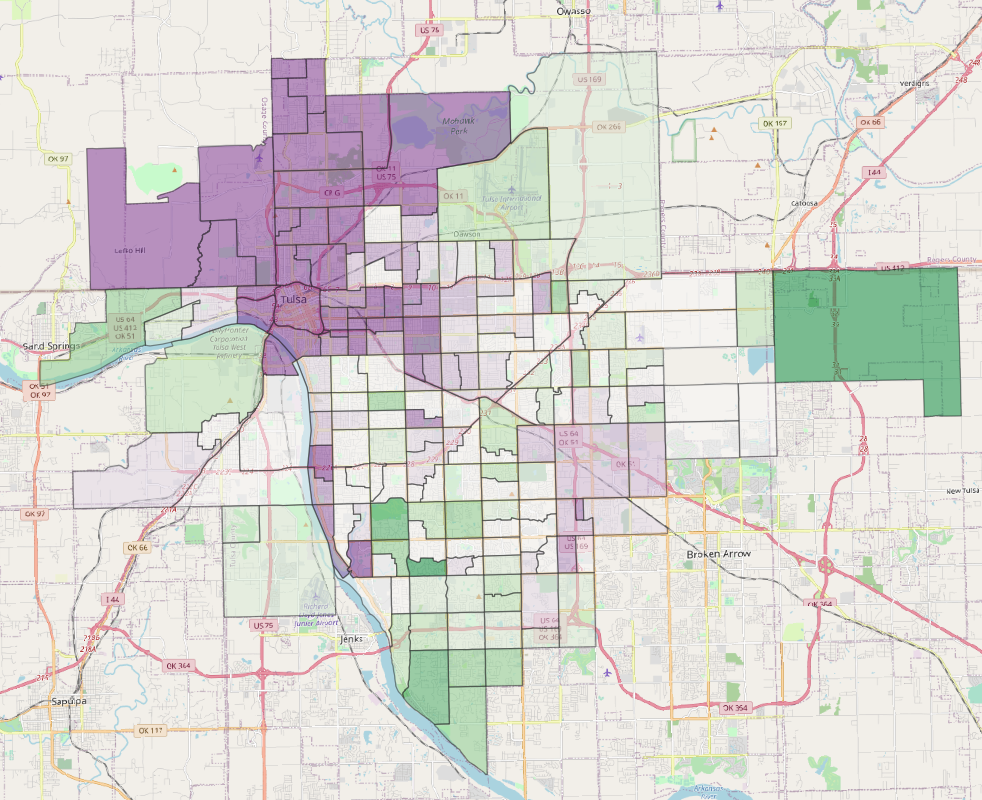
I started playing around with maps. I have QGIS, an open-source graphical information system suite, precinct and municipal boundary shapefiles from OK Maps, and precinct-by-precinct results from the Oklahoma State Election Board. I used Microsoft Access (I know, I know) to process the election board data before linking it to the precinct map. Here's my first, clumsy effort: A map showing the "swing" between Bynum's June 2016 vote and his vote today. The deepest purple shows precincts where Bynum's share of the vote fell by at least 25 percentage points; darkest green shows where Bynum's share of the vote went up by at least 25 points; in precincts with no color, his 2020 share of the vote was within 5% either side of his 2016 share.

Recall that in 2016, Bynum was effectively the Democratic nominee, the progressive candidate, as no prominent Democrat sought the office. Bynum won with support from Democrats along with those Republicans who were disappointed with Dewey Bartlett Jr's service as mayor. This year, Greg Robinson captured those left-wing voters, while there was no well-funded or well-organized candidate to Bynum's right. Bynum's vote slid most dramatically in north Tulsa and midtown, while his vote improved in south Tulsa.
Now, there are all sorts of problems with the map above. I haven't figured out how to tweak the projection so that a line drawn north through the center of Tulsa points straight up (the shapefiles I'm using are based on Oklahoma as a whole). I haven't figured out how to add a legend, and I didn't bother adding precinct numbers as labels. I haven't done an intersection between the precinct shapefile and the municipal shapefile so that I only show the portions of precincts that are within the city limits. There's no proprietary watermark. All that said, it does give you a picture of how votes shifted, and I hope to put together additional (and more attractive) maps in the near future.
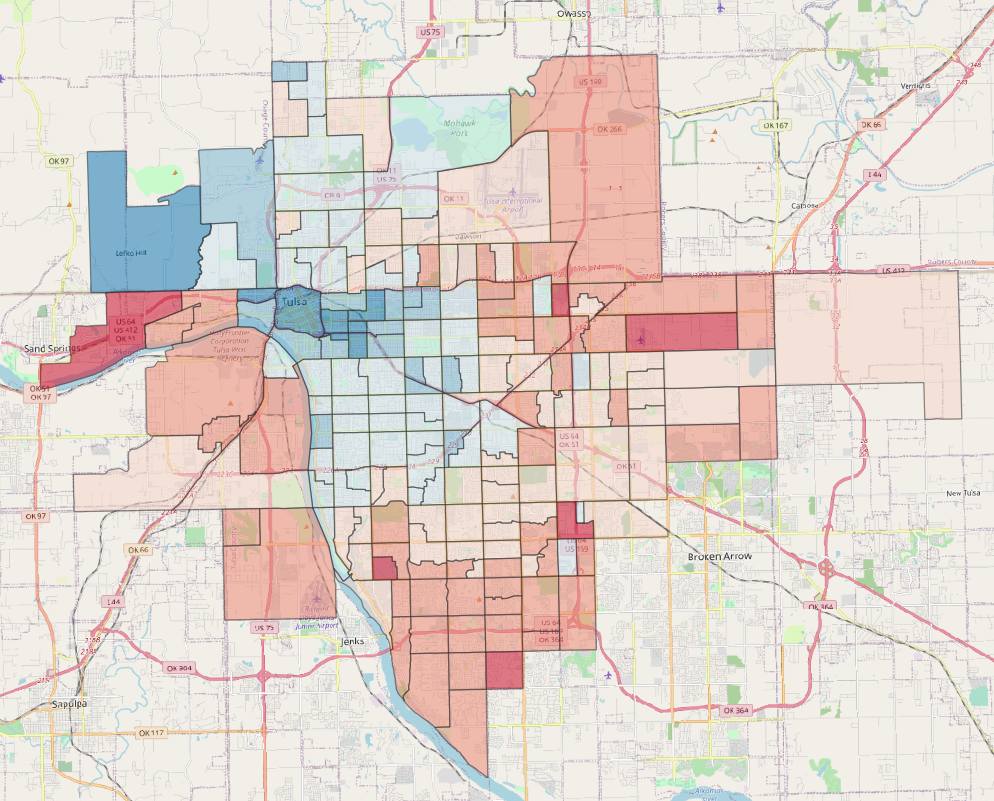
Here's one more: The percentage voting yes or no for Proposition 2, which involved changing a handful of references in the City Charter from he/him to they/them to be "inclusive." Darkest blues are yes > 70%, darkest reds are yes < 30%. Overall, the proposition passed by the narrowest margin of the five on the ballot, with 54.7% support.
