MIT: April 2011 Archives
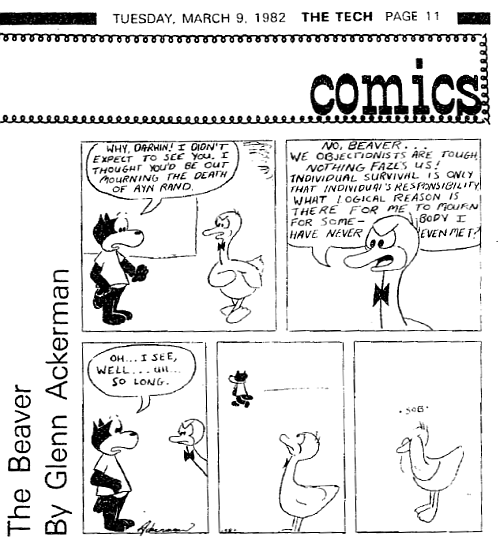
It's odd what sticks with you over the years. A blogpal's Facebook quotation of a surprisingly emotional and romantic passage from Ayn Rand's novel Atlas Shrugged (the film version debuts this weekend) was a reminder that Rand and her admirers were not exactly Vulcans, and it brought to mind a cartoon that was published in The Tech, MIT's student newspaper, in the issue following Rand's death in 1982 (PDF). Thanks to the miracle of the Internet, I could find the comic strip, which features two anthropomorphic animals as MIT students, Beaver, the protagonist, and Darwin the Duck, who belongs to MIT's "Objectionist" Society and works on the Ego. (There was a weekly newspaper called Ergo, published by objectivists from MIT and other area colleges.)

I could easily get lost browsing through issues of The Tech from college days. All 131 years of The Tech are online. In 1982, there was a well-drawn, consistently funny strip called Space Epic by Bill Spitzak -- still funny after all these years. Spitzak was a computer science major and went on to develop the Nuke compositor for use with computer-generated special effects, first used in the movie True Lies.
In that same issue, the Tech Coop advertised a special deal on cases of Coke and Tab -- 24 cans for $5.99 (regular price $8.75). It's amazing to think you can still get a case of soda for the same price, when it's on sale.
A few issues later, there was this front page chart with MIT admission stats for application years 1980, 1981, and 1982. I've added the stats for the most recent two years from reports in The Tech (for 2010; 2011):
| 1980 | 1981 | 1982 | 2010 | 2011 | |
| Applicants | 5643 | 5893 | 5790 | 16,632 | 17,909 |
| Acceptances | 1773 | 1694 | 1884 | 1,676 | 1,715 |
| Waitlisted | 335 | 429 | 300 | 722 | |
| Men | 1349 | 1249 | 1414 | 53% | 51% |
| Women | 429 | 445 | 470 | 47% | 49% |
| Minority | 147 | 170 | 182 | 23% | 26% |
| Foreign | 55 | 52 | 68 | 7% | 8% |
Stunning. Applications have almost tripled, while acceptances (and incoming class sizes) have remained constant over 30 years. Notice too that the male-female ratio has gone from 3 to 1 my freshman year (which already represented a decline) to almost 1 to 1 today. Also, it appears that "underrepresented minorities" (African Americans, Native Americans, Latinos, but not Asian Americans or Jews) are no longer underrepresented. And despite the higher ratio of international students, they have the worst ratio of applications to acceptances -- about 3%.